Football Analytics on Twitter
Intro
In my previous post I showed how to create a model to predict the number of points of a football team starting from simple data. I am going to show here how to use the model to create a meaningful visualisation and share it on Twitter. The idea is to publish the predicted points resulting from my model against the actual points scored by the serie A teams weekly. Also, I think it would be less time consuming and more efficient to automate the whole process. In this post I will explain how to write a script to:
- Extract the data published weekly on serie A match results.
- Apply a pre-trained model to these data.
- Publish the result on Twitter.
- Get the script to run following a schedule.
Data Extraction
The data extraction process is very simple. On this website there are all data needed to get the features and apply a previously trained model. One can look at the previous post to understand how one can build a model from scratch.
Using pandas one can read the file directly from the website
import pandas as pd
df_week = pd.read_csv("http://www.football-data.co.uk/mmz4281/1617/I1.csv")
Here one opens only the latest serie file and in the dataframe there are all match infos for the season, results, shots on target, corners…
The next step is to calculate the features one uses in the model. This has been covered too in the previous post. These must be the same features used during model training.
Model Fitting
A step back now. When one builds a model in scikit-learn there is the option to store the trained model in a file and use it later on updated data. The process to do it is the following.
from sklearn.externals import joblib
regr = linear_model.LinearRegression(fit_intercept=False)
regr.fit(features,target)
joblib.dump(regr, 'linreg_model.pkl')
First of all one imports the joblib library, used to store the results of the training. The model is then created, fitted on some data and saved in a file. Just 4 lines of code.
Once the model has been saved one can read it again doing:
model = joblib.load('../linreg_model.pkl') The model can be readily applied to the new data doing:
pred_1617 = model.predict(feat_1617)Here the pred_1617 list contains the predicted points for the serie A teams updated for this week.
Publish the result
This is probably the most difficult thing. One often arrives at the end of an anlysis and has troubles understanding exactly what is the result obtained. And of course, what is the best way for showing it. A good idea is to have in mind an interesting question and a possible answer before starting the analysis. In this case the question would be
Are a serie A team’s actual points more or less than the expected ones at this point in the season?
This is a reasonable question to ask, since one has a model that directly correlates shots, shots on target, corners and so on to the actual mumber of points expected.
A way to visualise this information is to show one next to each other the points expected/actual as bars. It will be clear which is the luckiest/unluckiest team.
For an example on how to create a barchart of this kind one can look here. Starting from this simple chart and 2 lists, actual and predicted points, it is quite easy to create a visualisation like the one below.
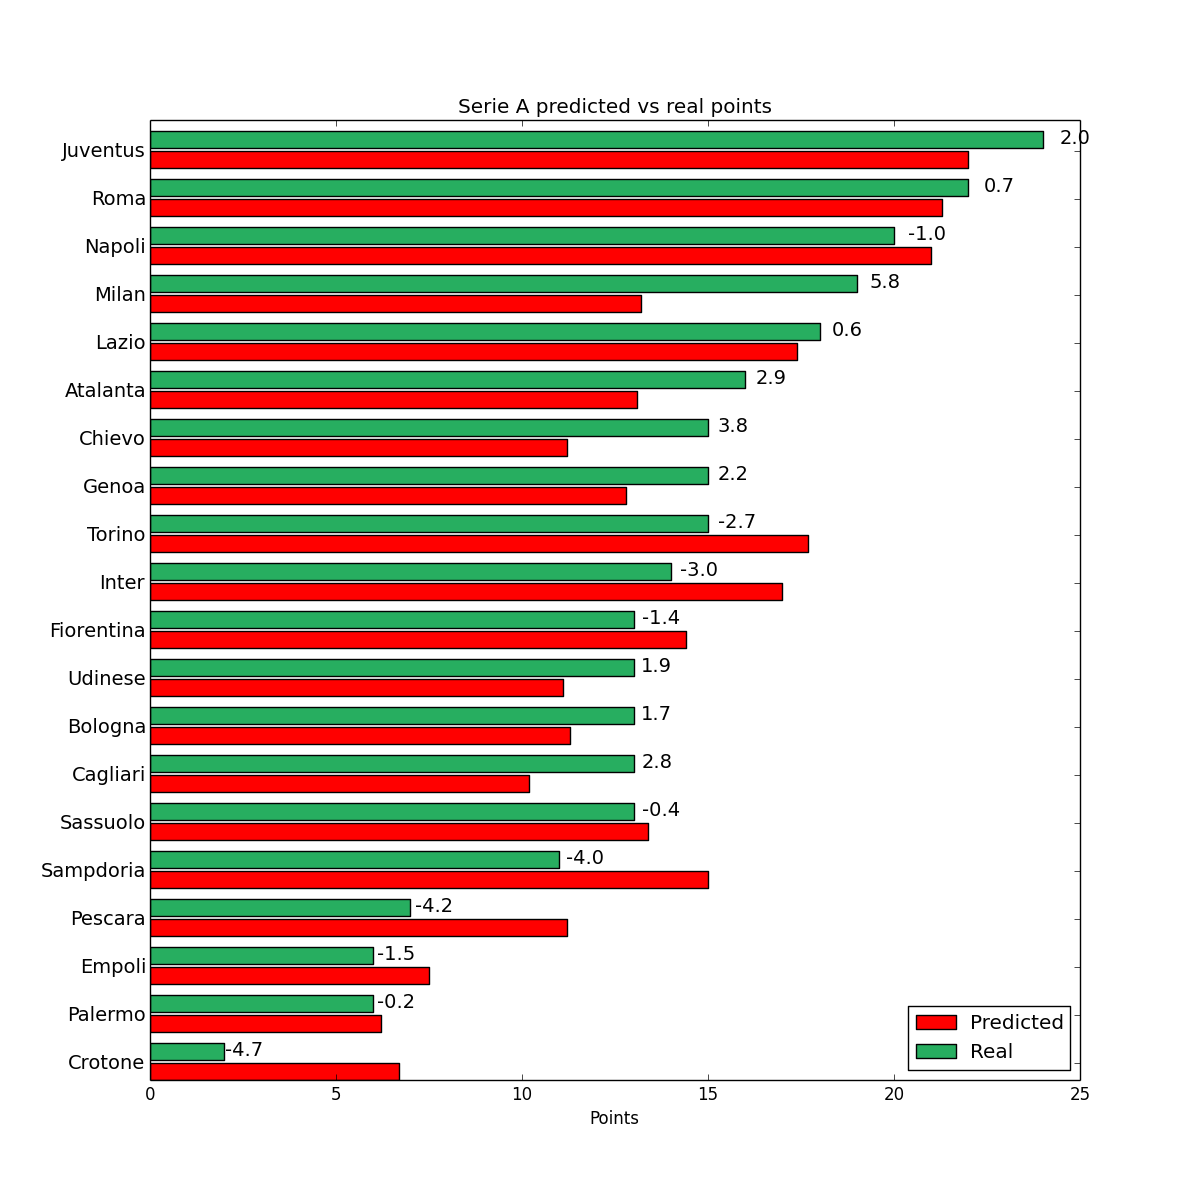
This is a bar chart that shows predicted (red) vs real (green) points for serie A teams. On the left the team name is written and next to the bars there is the difference between expected and actual points.
This is an image that can be shared already. But one can stil do better and automate the whole thing.
Analysis Automation
The steps described above can be summarised in a single script. The only missing bit is the part where the content produced is shared and one can actually integrate it easily with the help of a library called tweepy.
auth = tweepy.OAuthHandler(CONSUMER_KEY, CONSUMER_SECRET)
auth.set_access_token(OAUTH_TOKEN, OAUTH_TOKEN_SECRET)
api = tweepy.API(auth)
status_str = "#serieA predicted vs actual points after "+str(fixt)+" matches."+unluckiest_team+" the unluckiest."+luckiest_team+" the  luckiest."
api.update_with_media(filename="serieA.png",status=status_str)
The pre-requisite here is to create a twitter app in order to be able to access their API. One just goes here and clicks the Create New App button.
The credentials of the App can be used to set up the keys in the first 2 lines above.
Then an API object is created, a message to attach to the tweet is created with information about the fixture, the luckiest and unluckiest teams and finally a tweet is sent with an attached media (the barchart file) and a status (the message just created).
The last step is to deploy this script somewhere so that it runs automatically every week after the last fixture.
One can buy is own server, set up an environment and create a scheduled task, but this is 2016 and a cloud solution is readily available out there.
I use pythonanywhere. With 5 USD a month you can create a scheduled task and the platform is very reliable, developers there are friendly, support is available in case you need it.
To schedule the jobs at the right time of the week a second script that calls the main script is the best solution
import model_tweet as mdt
def schedule():
  update_dates = ['2016-10-18','2016-10-24','2016-10-28','2016-11-01','2016-11-07','2016-11-21','2016-11-29','2016-12-06','2016-12-13','2016-12-19','2016-12-23']
  today_date =  datetime.date.today().isoformat()
  if today_date in update_dates:
    mdt.post_tweet()
The model_tweet script is imported and a list containing the dates we want to tweet is then created. The scheduler simply checks today’s date and calls the method to post the tweet in case the date is on the schedule. Easy.
Further developments
The analysis has become a twitter account that is not managed by anyone and tweets automatically every week or so. Training a model on other leagues data following an identical approach is doable and will show if there is any difference in the model factors between different leagues.
The model could also be used to assist in betting strategies. A simple one may be to identify teams in a lucky strike and sistematically bet against them.